How to add an editable chart to a presentation
Add a chart to your slides that stays editable: pick from 24 chart types, paste data from a spreadsheet or import a CSV, style it and export to PowerPoint.

A screenshot of a chart looks fine until the numbers change. Then you are back in the spreadsheet, exporting a new image, cropping it and lining it up on the slide again. An editable chart keeps the data inside the presentation, so a correction takes seconds and the chart always matches the theme.
This guide shows how to add an editable chart to a presentation in SlidesBat, fill it with real data from a spreadsheet, choose the right chart type and keep it editable when you export to PowerPoint.
Step 1: insert a chart
Open your deck in the SlidesBat editor and go to the slide where the chart belongs. A Chart layout slide gives you a title and space for the chart, but you can add a chart to any slide.
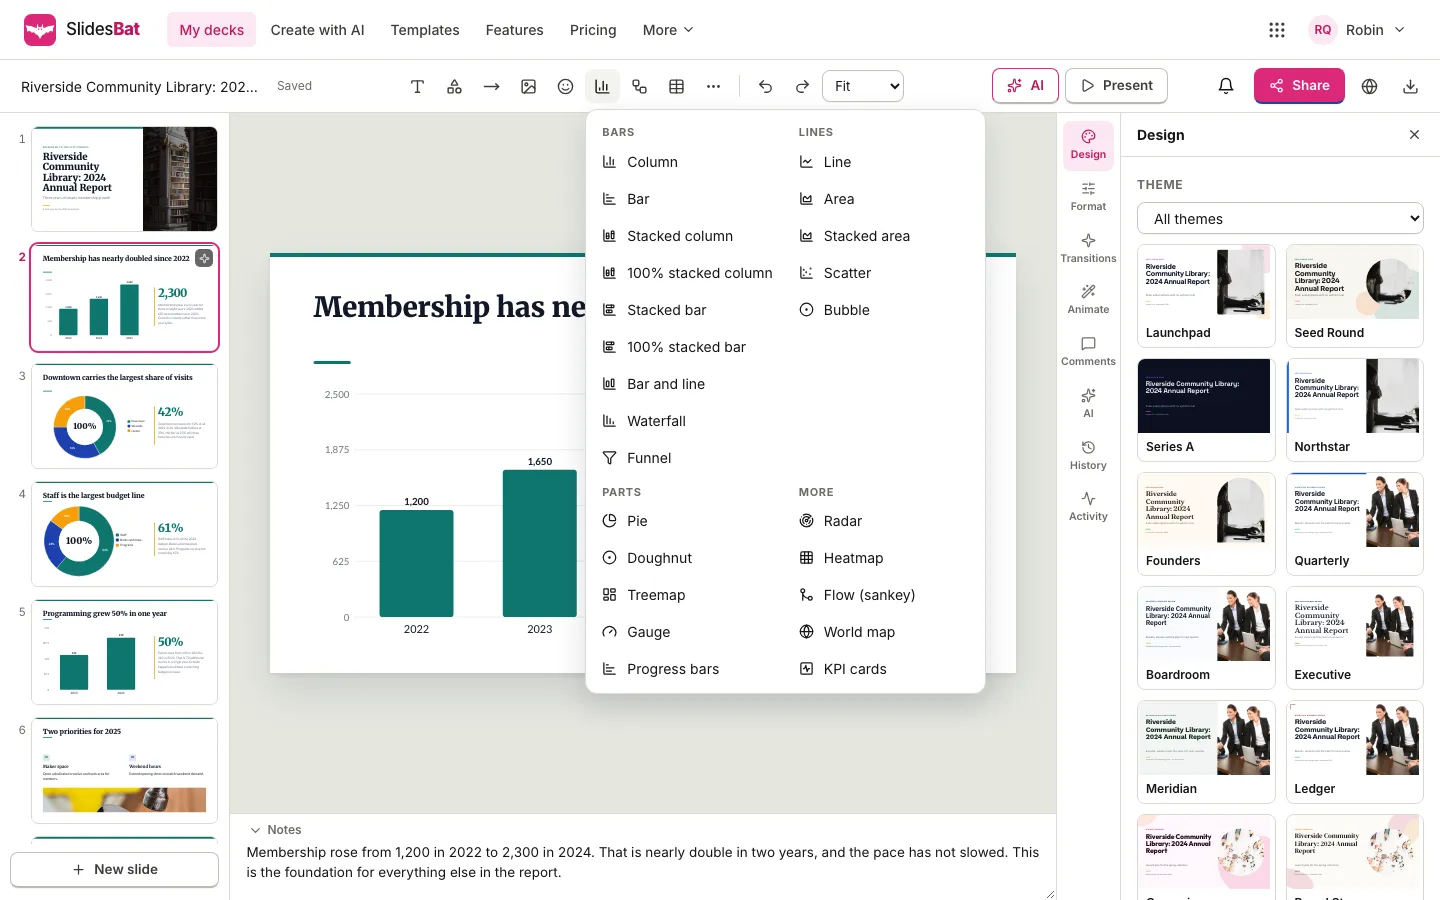
- Press Chart in the toolbar.
- Pick a type from the menu. Types are grouped into Bars, Lines, Parts and More.
- The chart appears on the slide with sample values for you to replace. Drag it into place and resize it like any other element.
Which chart type to choose
SlidesBat has 24 chart types. Picking the right one matters more than any styling.
| You want to show | Use |
|---|---|
| Values compared across a few categories | Column or Bar |
| Parts of a total, across categories | Stacked column or 100% stacked column |
| Change over time | Line or Area |
| Two measures with different scales | Bar and line |
| How a starting value becomes an end value | Waterfall |
| Steps where people drop off | Funnel |
| Share of one total | Pie or Doughnut, with few slices |
| Many parts of a whole by size | Treemap |
| Progress against a goal | Gauge or Progress bars |
| The relationship between two measures | Scatter or Bubble |
| Several qualities compared at once | Radar |
| Values across two dimensions | Heatmap |
| Where something flows | Flow (sankey) |
| Values by country | World map |
| Two to four headline numbers | KPI cards |
When in doubt, use a column chart. People read the length of bars more accurately than angles or areas.
Step 2: add your data
Select the chart, open Format on the right and choose Edit chart and data. The chart editor opens with three parts: the chart types on the left, a live preview with the data grid in the middle, and the options on the right.
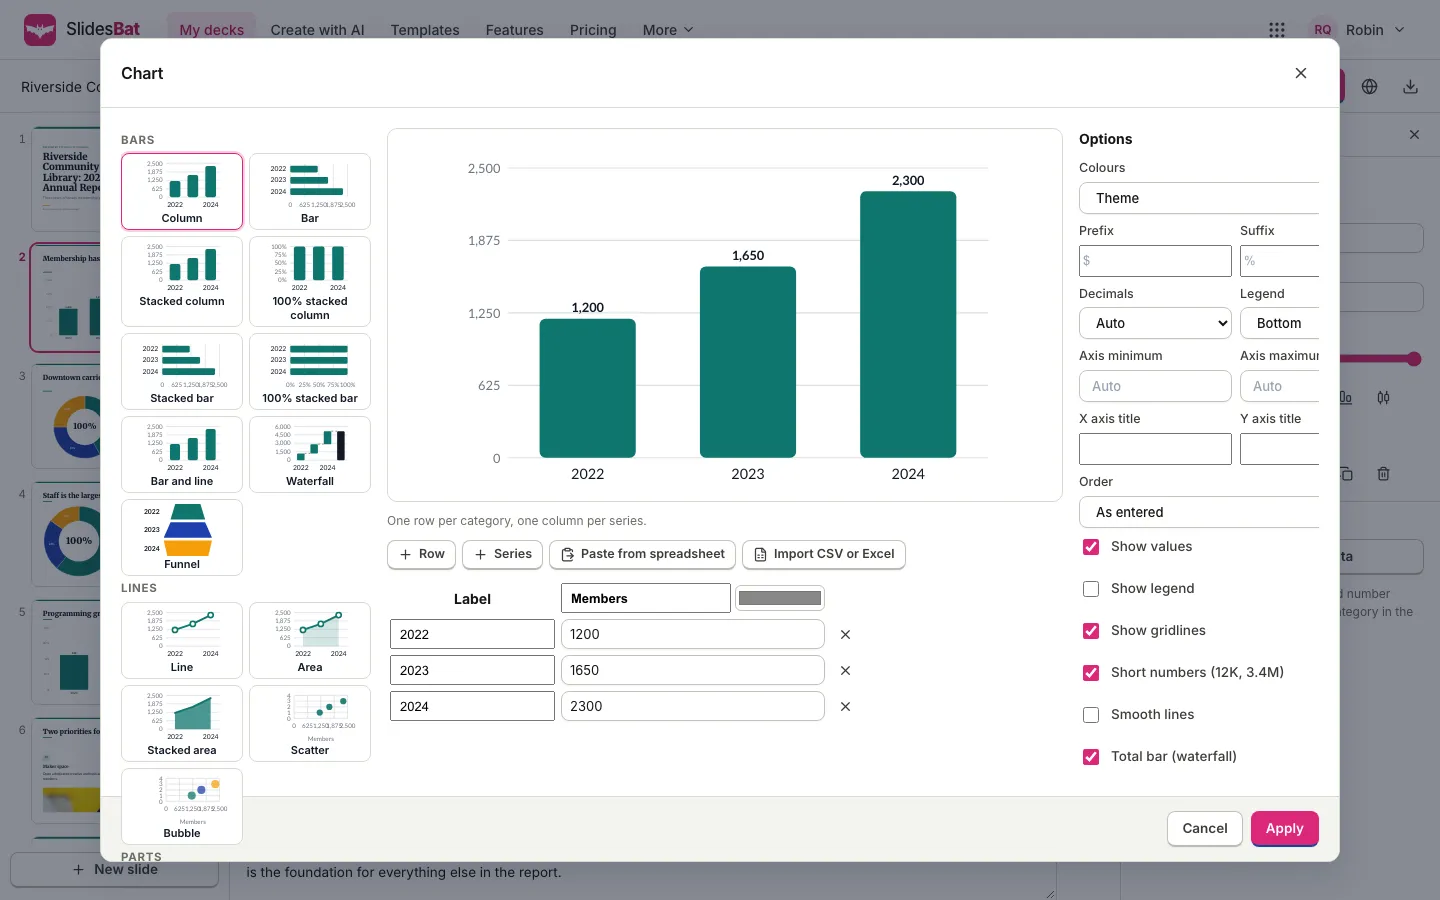
The grid follows a simple rule, shown under the preview: one row per category and one column per series. For most chart types:
- the Label column holds the categories, such as years or regions;
- each other column is a series, such as members or revenue, with its own colour.
There are three ways to fill the grid:
- Type the values. Use + Row and + Series to add rows and columns, and the cross to remove a row.
- Paste from spreadsheet. Copy the cells in SheetsBat, Excel or any spreadsheet, with a header row, then press this button. SlidesBat reads your clipboard and fills the grid.
- Import CSV or Excel. Choose a .csv, .tsv, .txt or .xlsx file.
The data needs a header row and at least one row of values. Some types read the grid differently, and the editor tells you how: in a scatter chart, each row is a point with X in the first column and Y in the second; in a world map, each row is a country name with its value.
Step 3: style the chart
The Options panel controls how the chart reads:
- Colours: the theme's colours by default, so the chart matches the deck. Each series can have its own colour from the swatch above its column.
- Prefix and Suffix: add a currency sign before values or a percent sign after them.
- Decimals: automatic, or a fixed number of places.
- Legend: where it sits, and Show legend to hide it when there is only one series.
- Axis minimum and Axis maximum: leave on Auto unless you have a reason. Starting a column axis above zero exaggerates differences.
- X axis title and Y axis title: add them when the units are not obvious.
- Order: as entered, largest first or smallest first. Sorting a bar chart makes ranking easy to read.
- Show values, Show gridlines, Short numbers (12K, 3.4M), Smooth lines and Total bar for waterfalls.
Press Apply to update the slide, or Cancel to leave it as it was.
Make the title say the point
The single biggest improvement to most chart slides is the title. Instead of "Membership 2022 to 2024", write "Membership has nearly doubled since 2022". The chart is then the evidence for a sentence the audience already understands.
Step 4: present and keep it editable in PowerPoint
Charts in SlidesBat are part of the slide, so they move, resize, animate and change theme with everything else. You can add an entrance animation to reveal a chart after you have set up the question.
When you download the deck as PowerPoint (.pptx), 15 of the chart types become native PowerPoint charts that stay editable: column, bar, the stacked and 100% stacked columns and bars, bar and line, line, area, stacked area, scatter, bubble, pie, doughnut and radar. The other types, such as waterfall, funnel, treemap, gauge, heatmap, sankey, world map and KPI cards, are placed as a picture in the same spot so the slide still looks right. PDF and PNG exports show every chart exactly as it appears on the slide.
Infographics when a chart is too much
Not every number needs axes. For a single striking figure, a sequence or a comparison, an infographic block can be clearer. SlidesBat includes blocks for big stats, icon arrays, comparisons, processes, cycles, timelines, org charts, mind maps, Venn diagrams, pyramids and matrices, edited with Edit infographic in the same Format panel.
Let AI build the first chart
If you create a deck with AI, an outline slide with the Chart layout can carry data from your brief or document, and the generated slide includes the chart. Check the values against your source, then refine it in the chart editor as above. For the full workflow, see how to make a presentation from a Word document with AI.
Common chart mistakes on slides
- Too many series. More than four colours on one chart is hard to follow from the back of a room.
- Pie charts with many slices. Use a bar chart, sorted largest first.
- 3D effects. They distort values. SlidesBat charts are flat, so values read true.
- Unlabelled units. Use a prefix, suffix or axis title.
- Tiny text. If you cannot read it in the slide sorter thumbnail, it is too small for a projector.
If your data lives in a spreadsheet, see XLOOKUP vs VLOOKUP with examples for pulling the right numbers together first, and when you present the deck, use presenter view with speaker notes to talk through each chart.
Frequently asked questions
How do I add an editable chart to a slide?
In the SlidesBat editor, press Chart in the toolbar and pick a type. The chart appears with sample data. Select it, open Format and choose Edit chart and data to enter your own values, then press Apply.
Can I paste chart data from Excel or a spreadsheet?
Yes. Copy the cells with a header row, then press Paste from spreadsheet in the chart editor. You can also use Import CSV or Excel to load a .csv, .tsv, .txt or .xlsx file.
Do charts stay editable when I export to PowerPoint?
Fifteen chart types, including column, bar, line, area, pie, doughnut, scatter and radar, export as native PowerPoint charts you can edit. The others are placed as a picture in the same spot.
How many chart types are there?
There are 24 chart types in four groups: Bars, Lines, Parts and More. They include waterfall, funnel, treemap, gauge, heatmap, sankey, world map and KPI cards.
Will the chart match my presentation theme?
Yes. By default a chart uses the theme's colours, and it updates when you change the theme. You can also set a colour for each series.